
Chapter 24: Measuring Impact - DORA, SPACE & AI ROI
If You Cannot Measure It, It Is Not in the Plan
AI adoption is not measured by license count. If the only metric is "we bought 200 seats," procurement had a sprint and nothing else happened. Real measurement connects AI investment to outcomes the business cares about, with baselines set before the rollout so the improvement is provable rather than asserted.
DORA: Delivery Performance
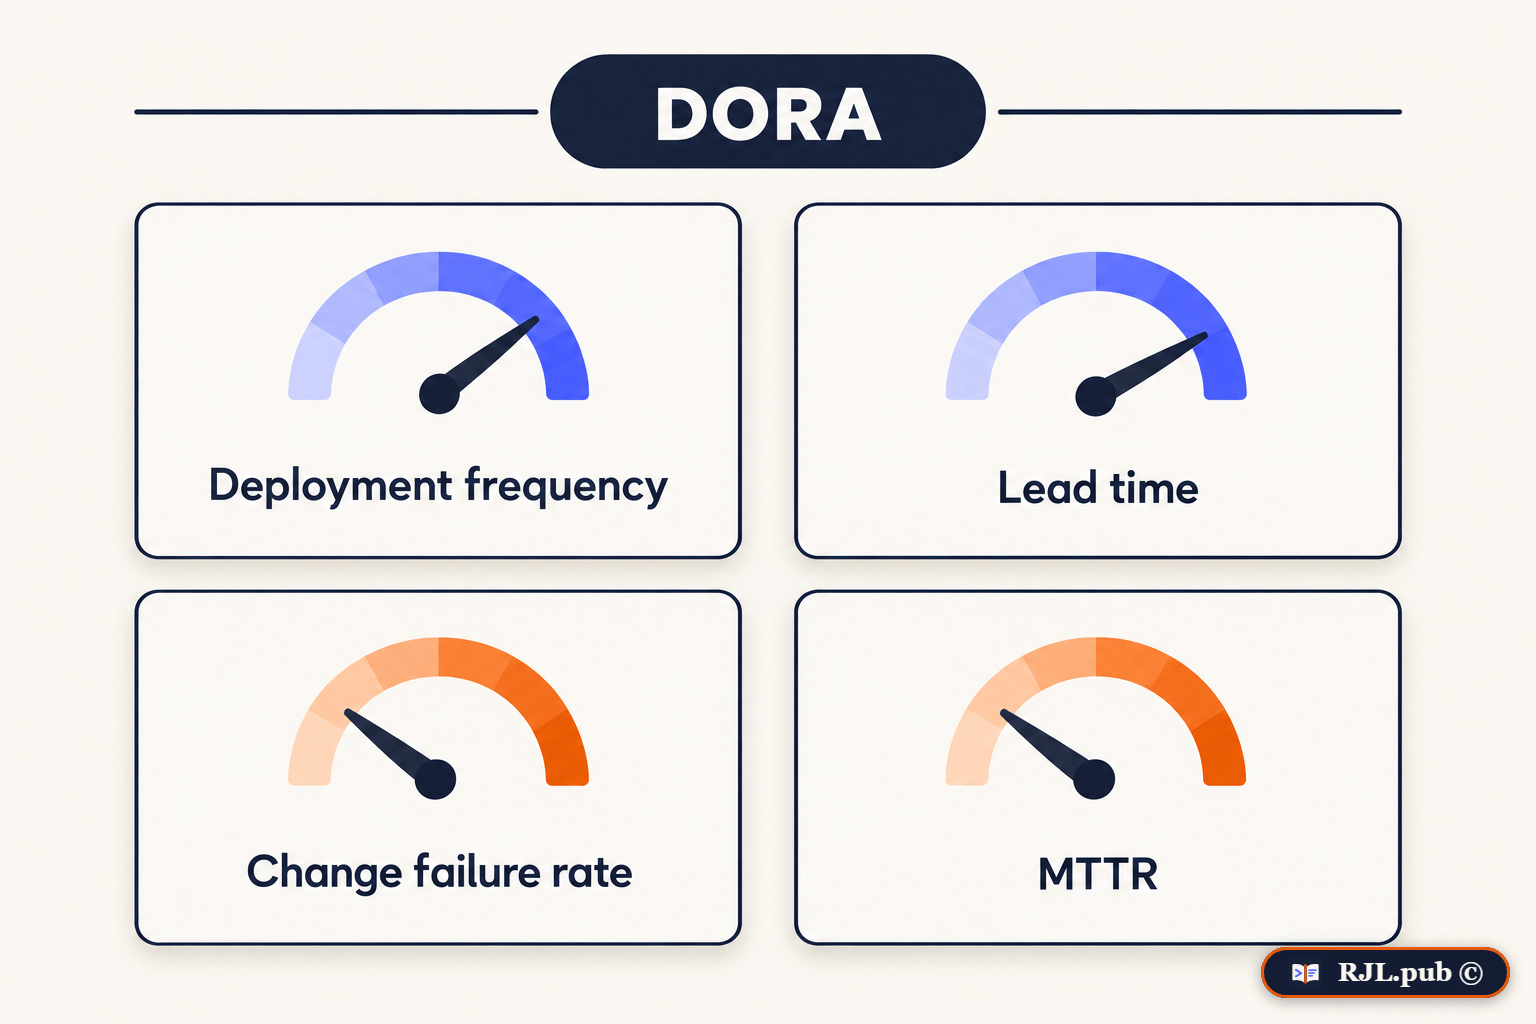
The four DORA metrics are the objective baseline for engineering velocity, benchmarkable and legible to any board:
* Deployment frequency - how often you ship
* Lead time for changes - commit to production
* Change failure rate - how often a change causes a problem
* Mean time to recovery (MTTR) - how fast you recover
Operationalizing agentic AI across the SDLC moves these together: roughly 5x deploy frequency, code-to-release cycle time down 40%, and MTTR cut around 30% are representative when agents run as first-class pipeline stages with quality gates intact.
SPACE: The Human Side
DORA measures throughput; it cannot see whether engineers are thriving or drowning. The SPACE framework fills that gap: Satisfaction and wellbeing, Performance, Activity, Collaboration, and Efficiency. Teams that score well here retain talent and compound output - and AI tooling that engineers genuinely like becomes a top retention factor, while tooling forced on them quietly fails.
AI-Specific Metrics
Beyond DORA and SPACE, track the signals unique to agentic delivery:
* PR throughput and AI-assisted PR review rate
* Test coverage trajectory and escaped-defect rate
* Eval pass rate and agent escalation rate (Chapter 21)
* Cost-per-outcome and cost-per-workflow (FinOps)
* Onboarding time-to-first-commit
* Multi-model fluency as a leading indicator of team adoption
Leading vs Lagging, and Avoiding Vanity
Set baselines before any rollout, then trend the numbers - a single snapshot proves nothing. Distinguish leading indicators (adoption, eval pass rate, PR throughput) from lagging ones (deploy frequency, MTTR, business impact), and refuse vanity metrics. Seats purchased, prompts sent, and lines of AI-generated code are activity, not outcome. If a metric cannot be tied to a business result, it does not belong on the board slide.
Board-Ready Reporting
Translate engineering into business language: deploy frequency, MTTR, SLA attainment, and AI ROI - not sprint burndown or story points. Tie cost-per-outcome FinOps directly to the value each automation delivers, so AI spend reads as visible OpEx attached to outcomes rather than invisible token burn in the cloud bill. That is how AI moves from a cost center with no visibility to a measurable operational asset the board will keep funding.